Final Pew Poll - November 4, 2012
Likely Voter, 2709 sample size, Obama leads 48-45, 4% undecided.
Again, RCP chooses to select among two numbers provided by the poll and chooses the one more favorable to Obama. RCP is reporting Obama leading 50-47, but that number is only acheived by allocating the undecided voters 50/50. This is not a very good approach, since undecideds at this point are likely to either support Romney or not vote. It is another example of RCP cherry picking to show a result more favorable to Obama.
The last time this poll was run the D/R/I was 35/34/30 or D+1. This time they have increased the Democrats in the sample to D+4 with a D/R/I of 36/32/29. Independents have moved from favoring Romney by 8 to favoring him by 2.
Putting these results through the models, we get the following:
O+3 - Current result
O+4.0 - 2008 turnout
O+1.1 - D+3 turnout
R+1.2 - 2010 turnout
R+1.3 - 2004 turnout
R+3.1 - Rasmussen Party ID
Even with the partisan split, this poll is still showing a shift toward Obama of about 1.5 points. Having said that, consider the following table included in their release:

Notice that the enthusiasm number for Republicans has increased since the last poll and they maintain a significant advantage over the Democrats. This leads to the conclusion that a D+4 turnout is very unlikely to occur, and that the Even or better turnout I expect is more likely.
So why is this poll so skewed? The obvious answer can be found in the following table:
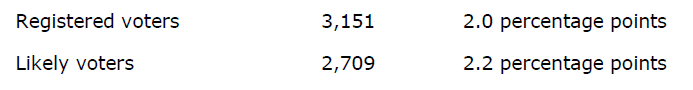
The like voter screen is way to loose, and is certainly driven by the fact that 34% stated they have already voted. The total of early votes nationwide is barely over 20%. Whatever the reason, the likely voter screen indicates that we will have an 85.9% participation rate. Here are the participation rates of all Presidential elections going back to 1988:

Clearly, Pew has too many Likely Voters in their screen. About 27.7% too many. History has shown that Likely Voters trend toward Republicans more than Registered Voters.
In the end, this is Pew's final opinion on this race.
Pew's final prediction is Obama winning 50-47.
However, based on the evidence within their poll, I believe this poll properly points to a Romney victory.
Pew's poll supports a prediction of Romney winning between 50.2-49 and 51-48.
Interesting but also concerning. But as you said, the enthusiasm gap between the GOP and Dems is large.
ReplyDeleteCan someone explain the early voting numbers vis a vis polls? The polls consistently overstate the EV reality. Maybe they are counting as likely voters folks that have their ballots sitting in a pile of junk mail.
ReplyDeleteThe polls and the EV data from various secretary of states offices are basically decoupled from each-other.
DeleteFor instance,the EV in Ohio up to Sunday night:
Democrats: 557,177 have voted, down 154,911 from '08
Republican: 480,843 have voted, up 108,345 from '08
Swing 263,256 Votes
Obama '08 margin was 262,224
And the tempo has been a decline since the early democratic burst in EV. On Sunday the EV total from democratic bastion Cuyahuga County were roughly 30% under-performing their 2008 yield: 2,211 voted today by 6 p.m. verse '08s 3,534.
This supports the RNC's hypothesis that the democrats where cannibalizing their dedicated voters to post inflated early voter numbers.
Given the Obama campaigns vaunted "ground game" and emphasis on the early vote, I can't see where the votes for them to win in OH will structurally comes from.
I had posted my query on on the BG poll. I'm a bit rusty but do a good amount of empirical research and the sample size, enthusiasm, and the Undecided breaking didn't feel right to me.
ReplyDeleteDave, have you covered the lib theory that lots of R's (evil, scary Tea Party types) are "self-identifying" as I, hence the large I Romney gaps and big D+ samples? I don't personally believe it - because libs seem to be ignoring the fact that D's have abandoned their party in droves and R registration is up - but could it be supported by some of the numbers in the crazier polls?
ReplyDeleteNo. Mostly because I think it is a dumb theory. But if it lets them sleep at night, great.
DeleteI'm talked before that I think there are two types of people, partisans and non-partisans. My model uses that assumption as a simplifying factor.
And could you speak to this too: from HA, "Romney increased lead with indies today in Rasmussen (+9) and WaPo trackers (+3)."
ReplyDeleteI will cover those in my daily averages. I don't do separate posts for the trackers.
DeleteHow can we trust any poll that shows an 86% participation rate?
ReplyDeleteIt's pretty hard. But there are worse polls (like CNN).
DeleteWant to see some related insanity, try looking at some of the state level polls!
DeleteGravis Marketing poll of Ohio from October 27th, of 730 likely voters.
Their LV screen methodology:
"Results only include respondents who answered that they were registered voters, somewhat likely, likely, or very likely to vote"
Question 2: How likely are you to vote in this year’s presidential election?
Ohio Voters
Very unlikely - 0
Unlikely - 0
Somewhat unlikely - 0
Somewhat likely - 1
Likely- 12
Very likely - 68
Already voted - 20
---------------------
Total = 101% (w/rounding error)
Thus, Likely Voters = Registered Voters
There is effectively no LV screen in this poll. 100% of the Registered Voters they called were classified as Likely Voters. They all crossed over; there is no filter.
The wait is agonizing. I think in the end Romney will win 51-47 mainly because Obama on average has topped out at 47 and with the Independent vote, Reps enthusiasm and the undecideds breaking for the challenger will lead to the victory.
ReplyDeleteI think the Pew partisan split numbers are worse than what you post.
ReplyDeletehttp://www.people-press.org/files/legacy-pdf/11-4-12%20Election%20Weekend%20Release.pdf
On page 9 it has the party ID breakdown among likely voters. 843 respondents were Republicans, 1,007 were Democrats and 761 were Independents, for a total of 2,611 respondents. That means the real split of the poll is 38.6D/32.2R/29.1I or D+6.4, which is close to the 2008 election.
Which, I'm guessing, would make the numbers even better for Romney in your analysis.
I will take another look at it tomorrow, and update the post if needed.
DeleteI'm finding these pollsters to be worse liars than politicians.
I noticed that also, Brandon. Those numbers contradict what they post 3 pages later...
ReplyDeleteAnother thing I find strange: 14% of Mod/Lib Republican for Obama, 6% Mod/Cons Democrat for Romney.
Good catch. Another thing that doesn't make sense.
DeleteI didn't notice that, but then my model specifically ignores data like that, so I wasn't looking for it.
DeletePew is setting up a "We wuz robbed" scenario for the Dems so that Romney can be delegitimized during his term in office!
ReplyDeleteOnly an idiot would fail to recognize the consistent Romney lead among Indies and the failure of the Dems to match their 2008 numbers in early voting, as well as the Pubbies well-known and documented Election Day drubbing of Dems..