Friday, November 9, 2012

And I think I'm done with it all

I didn't sleep again last night, and it is time for me to move on emotionally.

Having looked at Florida I think I know what happened, and it probably happened nationwide.  I do not think it was massive vote fraud.  There was definitely fraud in Miami-Dade which turned Florida to Obama.  But there is a reason we say "win beyond the margin of fraud".  We didn't win by enough.  This allowed the votes of a single large Democrat county to manipulate the vote totals enough to swing the election.  I suspect this occurred in all the rest of the swing states.  For future reference, if a Republican wants to win in Florida, he needs to win by over 500,000.

So what went wrong?  Romney turned out enough votes in every county to exceed McCain's numbers.  But he didn't exceed by enough.  Whether or not this was a failure of the ORCA program, or a failure of the campaign, I can't tell you.  I don't think it matters.

We don't have enough votes to win a national election, and I don't think we ever will.  The Democrats have their core votes who they have proven able to turnout as needed in an election.  Our core votes appear to be barely enough to match them, but not by enough.  And not enough to overcome election tricks and fraud to which they have no moral objection, but we do.

I actually believe that the Rasmussen month party ID poll is correct.  Republican identification is 4 points higher than Democrat identification.  The problem is that they have enough certain voters to produce a D+6 electorate.  This is now the second election that it has occurred.  Republicans can only get about 33% of the electorate to the polls, the rest of us don't vote.

There is no specific block of voters that sat out.  SoCans, FiCons, and Hawks all turned out at expected levels.  But they aren't enough.

The problem is the less engaged low information voters.  They simply won't vote for Republicans.  The culture and the media have made it such that our beliefs and values are mocked and ridiculed, and that matters.  These voters are shaping their political opinions by watching The Daily Show.  Principled positions that are important to members of our coalition are considered worthy of contempt.  Gay marriage and antisemitism are now the cultural norms, leading us to loss of freedom and a more dangerous world.

I fully expect that with this loss the Republican party will now begin to pander to client groups in attempts to woo them into voting for us.  This will be ultimately futile.  It will shatter the coalition and enable the Democrats to further consolidate their voting blocks with these groups.  The media and the culture are our enemy, and we can't win.  We have no way of making free market capitalism attractive to the Honey BooBoos of the country.  Not to mention principles positions on the sanctity of life.

On the pro-life position, we have lost.  Infanticide is now considered a cultural norm, and anyone who believes that the brutal mutilation and murder of an unborn infant in the womb is just a neanderthal who doesn't understand women's health issues.  Again the culture has driven us to this point.  Young women under 40 will actually vote to keep their right to murder the child of an unplanned pregnancy over being employed.

At the end of the day, we just aren't hip and cool.  The Jay-Zs and Kelly Clarksons of the world are determining who the rest of those voters will vote for.  It isn't going to be us.

So now I am going to disengage and try to live my life in some level of comfort.  I feel an acute sense of betrayal by my fellow citizens.  Since there is no place else to go, I will have to try and hunker down into a shell and try to drown out the noise.  If the American people prove at some point in the future that they are willing to take up the mantel of the principles they were gifted, then perhaps I will reengage.  But I doubt they will.

It is worth remembering that Jeffersonian theory that the citizens own the State, may be the core principle of our founding, but it is not typical in the history of mankind.  Statist ownership and control of the citizens is the normal way human governments have been established, either through monarchies, tyrannies, or bureaucracies.  It is not surprising that our country will slowly march toward Statism.  It is the typical choice, and can be seen in the voting choices in France and the UK.

So if that is the choice we have made, there is nothing I can do to stop it.  I have maybe 30 years left in my life, I'm going to try and enjoy them as much as I can.  And try to pretend that politics are unimportant.

Thursday, November 8, 2012

I'm still working numbers, but...

I can tell you where fraud occurred if it did.  There are only 1 county where Romney under performed McCain significantly.

Miami-Dade - 92% of McCain - 28,949 vote drop

In all other counties, Romney hit at least 97% of McCain's numbers. He exceeded them by a lot in other counties St. Johns and Sumter were up 113% and 132% respectively.

First odd thing

This is going to take time, so be patient.  I have a lot of data to input into a spreadsheet, and I'm working out how to manipulate the data to find what I want.  But let me give you a tidbit.

So far, I've done a couple counties, working in alphabetical order.  This includes 2 Democrat strong holds (Alachuha and Broward) and a Republican (Brevard, my home county).  I also did Miami-Dade because I was curious regarding them taking so long to close the polls, and reporting late.

So far, what I am finding is that Romney matched the McCain numbers in all the counties, 100% to 103%.  This includes Broward County.

The exception is Miami-Dade.  Romney hit 92% of McCain's number, with a drop of 29,900 votes.  Obama also over performed picking up 39,000 votes over 2008.  This is a 70,000 vote swing, and swings the election as we stand today.

Now Miami-Dade is next door to Broward, but Broward has a larger percentage of Democrats.  So even though Miami has more Republicans than Broward, less of them turned out to vote. 

Meanwhile Obama matched his 2008 numbers in Broward, but dramatically over-performed in Miami-Dade 101% to 108%.  This despite the fact that Broward has a much higher percentage of Democrats, 53% to 44%.  The counties are about the same size and had almost identical participation rates.

I have a lot more counties to enter, so this will take awhile.  But I wanted to give you an idea of what I am seeing so far.

Was it Stolen?

I hate going down a birther road, but yes I believe the election was stolen, and the implications of that are very bad.

First of all, Obama received 10 million less votes than he did in 2008.  The part that is unbelievable is that Romney received 3 million less votes than McCain.  At the end of the day, Obama won in the 4 critical swing states by 500,000 votes.

But is is worse than that.  We can look at who voted.  By examining the number of Independents and their preference shift among actual voters, we know that 5 million Independents changed their votes from Obama to Romney.  So Romney started the day 2.5 million votes ahead of where McCain was in 2008.

This means that 5.5 million Republican voters are not accounted for.

They didn't show up at the polls, or their votes were not counted.  We know now that no subgroup of the coalition decided to sit out.  So the current attempts to blame the SoCons are stupid.  All of our groups showed up to vote at the rates they did in 2008.  For this to be true over 10% of Republicans needed to decide not to vote this year, who did vote in 2008.

Does that make any sense?

In fact, it is even worse, we know for a fact that heavy GOP counties were swamped all day.  We watched all day as Pasco County Florida was showing huge increases in GOP voters over the 2008 numbers.

In Virgina, with 69% of the precincts in, Romney held a 6% lead.  Yet once a small number of counties reported, that lead disappeared.


If the vote drop off occurred, it occurred in a very small number of counties.  It was not visible nationwide.

I contend that you can not get a 10% drop off in GOP turnout without it being noticeable during the GOTV effort, measures of enthusiasm in polling, or visibly lower turnout in GOP leaning precincts.

I know you don't want to believe such a thing is possible.  You don't want to think that the Obama campaign would engage in such blatant election fraud.  But these are the same people who ran Fast and Furious without regard for the cost in human lives, turned off their credit card verification system to allow fraudulent donations, and allowed CIA operative in Libya to die because it was politically inconvenient.  Do you really think that massive election fraud is something they wouldn't do?

If this is true, then we have some hard things to consider.

First of all, we are now needlessly fracturing our coalition pointing fingers at people for not voting.  Second, we are making an assumption about the make up of the American public that is not true.  We are going to modify our party and message to appeal to a group of individuals who do not represent the majority of the population.

Most difficult to believe is that we are living in Venezuela where our elections are merely for show, and the people in charge of the Governments decide who will win elections.  We become wards of the State, which is the aim of those who stole this election.

So how can this be proved?

I am going to start by looking at a few key counties in Florida.  What I want to see is the voter registration numbers by party, and then compare them to the actual votes received.  Theoretically, if this were to be done for all counties in Florida, we could see where the fraud occurred. Comparing the votes Romney received to the strike lists would show that in specific counties Romney received something like 50% of the Republican vote (picking a number out of the air) while we know that nationwide he received 95% of the Republican vote.  To really get to the answer, we would need to get the registration books, which might be possible through Freedom of Information act.  Those show who actually voted, by name, and their party.

The media will not pursue this.  This will take citizen journalists working in every state.

Wednesday, November 7, 2012

Not at all what I expected


So obviously, my predictions were all wrong yesterday, mostly because no one saw the electorate really being D+6.  I still can't get my head around the fact that Romney received less votes than McCain, after being spotted 2.5 million Independent votes.

This was a turnout election that wasn't.  The lack of turnout also sank every Senate candidate, with the exception of Fischer and Heller.  At least those were the ones I said were at 100%, saving a tiny little bit of face.

One tiny nugget though.

I plugged the actual partisan split of the election in my model, and it would have predicted Obama 49.22 to Romney 47.68.  While it isn't the 50-48 that CNN has up it's web site, it is better than the 48.8 - 48.1 that RCP was projecting, and a lot better than the 2 point Romney win Rasmussen was predicting.

So in the end, there may be some value to this model.  All you need to know is what the turnout will be.  If I do this again, I will probably pay more attention to the reported partisan split and use an average of those to provide one of the model results.

Not that I am in much of a mood to be doing this again.  I think we have turned a corner in the country, and I am very worried about what that means.

I don't really plan to keep using this blog.  I have nothing really to say of much value now that the election is over.  So thanks everyone for putting up with me for the last month.

Tuesday, November 6, 2012

November 6, 2012 - My Final Prediction

If you haven't voted yet, why are you reading this?  Go vote!

I will not be doing any more poll averages after this, even with final polls that will drop today, like Fox.  I'm going with the final polls that have been released so far, and making my predictions.

Polls included:

Tracking Polls
R+1 - Rasmussen Daily Track
R+1 - Gallup
O+1.6 - IBD/Tipp
O+3 - ABC/WaPo

Others
R+1 - Battleground
O+3 - Pew
Even - CNN/ORG
O+0.005 - NBC/WSJ
Even - Monmouth

O+0.51% - Current RCP Average
O+1.40% - Average using the 2008 turnout model
R+1.52% - Average using the D+3 turnout model
R+3.85% - Average using the 2010 turnout model
R+3.92% - Average using the 2004 turnout model
R+7.02% - Average using the Rasmussen Party ID turnout model

Average Democrat advantage across all polls: D+5.00
Average Independent support for Romney across all polls: +8

I thought long and hard about including the CNN poll in the final analysis, and in the end decided I would do so.  It heavily favors Romney, but I think it helps better capture the Independent support Romney has.  For most of these polls I have posted in depth analysis, and I don't need to revisit those.

As I said before, I am offering three election scenarios.  D+3, Even, and the Rasmussen Party ID.

D+3:  (likelihood 10%) One of the reasons that I think the pundits and pollsters have been expecting a D+3 turnout this year is that looking at 2008, the Dems turned out at D+2, while the Republicans were at R-5 over 2004.  I believe the thinking is that the Dems will still be able to turnout their base and execute their election strategy, but the Republicans will bring their base back to almost 2004 levels.  I believe that this is the Romney campaign's turnout model.  For weeks now, the only cold water that I have had thrown on my expectations has been from the campaign itself.  I keep thinking this will be a blowout, then they leak some internals showing them barely ahead in Ohio.  However, from their perspective this makes complete sense.  They are still polling, and must apply a turnout models to determine the results.  They have to assume that their competition will be able to execute their turnout strategy as well.  You can't go into a turnout election assuming the Democrats won't turn out.  Having said all of that, I think they have over estimated the Democrat's ability to turn out their base.  The early voting numbers are down from 2008, and all of the campaigning on the other side has been designed to appeal to the base.  Obama has made no effort to appeal to the Independents or undecideds.  On the other hand, I think the GOP has underestimated the enthusiasm of their base.  The size of the crowds at rallies has caught them by surprise, as has the number of volunteers.

Using this model Romney will win 49.21% to 47.69%

With this 1.52% win, Romney will take FL, VA, CO, NH, and OH for 279 Electoral Votes.

Even: (likelihood 65%) I view this turnout model to be the most likely.  Obama has a small lead in early voting that is overwhelmed by GOP turnout on Tuesday.  Obama is still able to get his core supporters to the polls, but it isn't enough to compensate for a very fired up GOP base and the Independents.  One factor that everyone is missing is the Evangelical vote.  As I noted in the IBD/Tipp poll, religious votes are favoring Romney by a large number.  This block is able to produce 25 million votes for the GOP, when it votes.

One of the things that everyone misses that the most played commercial of the Obama campaign is footage of Romney saying that he opposes Roe v Wade and will defund Planned Parenthood.  This might be a good commercial for the Obama base and the "War on Women", but it also drives evangelicals to the polls and makes them enthused to vote for Romney.  This ad may end up being the worst decision of the Obama campaign.

Using this model Romney will win 50.38% to 46.52%

With this 3.85% win, Romney will take FL, VA, CO, NH, OH, WI, IA, and PA for 315 Electoral Votes.
 
R+4.2: (likelihood 25%) This is the turnout to end all turnouts.  The irony is that all it take to believe this model is to believe the 3 month average of a poll of 45,000 respondents with a MOE of 1, is actually correct.  The average of the Rasmussen Party ID poll for the last 3 months is R+4.2%.  Even Gallup is finding that R+3 is possible, with leaners.  In this turnout model the GOP gets all of the self identified Republicans, and the reports that Obama has been cannibalizing his election day voters turns out to be true.  Turnout among Democrats is way down from 2008.

Using this model Romney will win 51.96% to 44.94%

With this 7.02% win, Romney will take FL, VA, CO, NH, OH, WI, IA, PA, MI, NV, OR, MN and ME-2 for 355 Electoral Votes.

Final Senate Predictions

I spent 40 minutes in line this morning to get into my polling place in one of the reddest counties in Florida.  When I arrived 10 minutes after the polls opened there were already 120 people in line ahead of me.  When I got to the front of the line there were 100 people behind me.

By comparison, in 2004, there were 20 people in line when I arrived at the polls.  2004 was an election with an Even turnout.

I will be making my final national election prediction in the next post, but I want everyone to understand that I am basing this prediction on an Even turnout.  If turnout is D+3 then some of these seats, like Wisconsin, won't fall to us.  But I view any D+ result to be unlikely right now.  On the other hand, if we have an R+5.8 results, then every competitive seat will be won by the Republican.  These races are very dependent on turnout.  In all races but two, there will be no Obama/GOP Candidate voters, but there will be Romney/Dem Candidate voters.  GOP turnout is critical to lifting these candidates to victory.  Romney will run ahead of the numbers for these candidates.  The only exception to this is Heller in Nevada and Brown in Massachusetts.  Both will out perform Romney in their races.

Races we will win
  • Nebraska 100% -  With GOP enthusiasm where I think it is, Kerrey has no chance of winning this race.  He was close in one poll, but that poll assumed Democrat enthusiasm that isn't there.
  • Montana 80% - Rehberg is ahead by 4 in the latest poll and almost at 50%.
  • Nevada 100% - Heller remains well ahead, even with Obama leading in the polls there.  This race is still over.
  • Wisconsin 90% - Romney is looking very strong in this state, and is confident of winning it.  That means Thompson will win too
  • North Dakota 90% - With GOP turnout, Berg will win this.
Races where it is competitive
  • Indiana 60% - I still think Mourdock will win this, but polling shows him down.  I have a hard time believing that Romney will get the GOP turnout he does, but Mourdock loses.
  • Massachusetts 60% - All polling now shows Brown with a small lead of 1 or 2 points.
  • Virginia 70% - Romney is winning this state, no question about it.  The question is by how much.  If turnout is high, Allen will win.  If Romney wins by his margin with NoVa Independents then Allen will have a harder time.
  • Ohio 60% - After looking deeply into Ohio, I think Mandel will win this race.  The polls are just not telling the true story, and Brown needs the early votes just like Obama does.  Those votes aren't there.  Mandel is polling behind Romney by about 2 points, so with a Romney win of 5% or so, Mandel will also win.
  • Pennsylvania 60% - Romney pulled over 30,000 at his event in Bucks County.  Smith has been blanketing the airwaves in PA for months.  I think this race looks a lot like Toomey's in 2010, and Smith gets a 2% win.
  • Missouri 50% - Similar to what is going on elsewhere, I think Akin will win this.  Romney holds a commanding lead in the polls, McCaskill is really disliked in the state, and the evangelicals are going to turn out.
Races we will likely lose
  • Florida 20% - Mack might pull this one out.  All the polls show Nelson leading by about 5.  But if Romney can win by 7 to 10 points, then he could pull Mack with him.
  • Michigan 10% -  No polling, but I see no reason to believe Hoekstra can win.
  • Maine 10% - The Independent will win this race.  He could decide to caucus with the GOP, especially if it means being in the majority.
  • New Mexico 10% - No change, I think Wilson will lose.
  • Connecticut 10% - I'm seeing no evidence that McMahon is going to close the deal.  And she could end up with Dems and Independents voting against her to keep the Senate out of GOP hands.  I think the unpopularity of Romney in the East that Gallup showed makes this a hard seat to win.

Probability of at least a tie in Senate = 95.1%
Probability of winning the Senate = 87.5%
Most likely outcome = 9 wins

Final prediction GOP wins 9 of these races and holds the Senate with 53-47 seats.

Final IBD/Tipp Poll - November 6, 2012

Likely Voter, 712 sample size, Obama leads 50.3-48.7, 0% undecided.

IBD/Tipp finally released their final tracking poll.  They are showing an Obama lead of 1.6%, with Obama at 50.3%.  However, be careful with that result.  Previously they have been finding about 6% undecided.  The top line number was reached by taking the remaining undecideds and assigning half to each candidate.  I think this is a poor model to use, since at this point undecideds will not vote for Obama.  They are deciding between Romney or not voting.  In my model I am using an undecided factor of 4% in this poll, which is slightly less than their previous results..  They do not reveal how many they had in their final poll.

The D/R/I of this poll remains the same at 38/31/32 for a D+7 result.  Independents favor Romney by 6 points, which tracks with most other polls.

Putting these results through the models, we get the following:

O+1.6 - Current result
O+0.4 - 2008 turnout
R+2.5 - D+3 turnout
R+4.7 - 2010 turnout
R+4.9 - 2004 turnout
R+7.8 - Rasmussen Party ID

One interesting tidbit in the poll was support for the candidates by religious affiliation:


Romney is leading Protestants by 21 points, and Catholics by 19 points.  Even the Jewish vote is way down for Obama, though the sample size was very small, so take it with a grain of salt.  These levels of support are going to be very relevant tonight.  Remember, these leads are in a D+7 sample.


The IBD/Tipp poll predicts a final result of Obama winning 50.3 - 48.7.

The models show that this poll actually indicates the following possible results:

Using a D+3 model Romney wins 50.74 - 48.26
Using an Even turnout Romney wins 51.87 - 47.13
Using an R+5.8 turnout Romney wins 53.42 - 45.59

Monday, November 5, 2012

Final? ABC/WaPo Poll - November 5, 2012

Likely Voter, 2345 sample size, Obama leads 50-47, 1% undecided.

I'm not sure if ABC/WaPo will run this tracking poll one more time, but if they do I may ignore it.  This tracking poll has been one of the silliest polls in the last few days.  It keeps increasing their sample of Democrats and unsurprisingly Obama's support at the same time.  Consider the following:


We've moved from D+3, to D+4, to D+6.  At the same time:


We've moved from Romney +1 to Obama +3.  Independents continue to support Romney by 2 points, as they did yesterday.

Putting these results through the models, we get the following:

O+3 - Current result
O+3.9 - 2008 turnout
O+0.8 - D+3 turnout
R+1.6 - 2010 turnout
R+1.8 - 2004 turnout
R+5.0 - Rasmussen Party ID

At this point this poll does not make a prediction on who will win the race.  However, it indicates the following possible results:

Using a D+3 model Obama wins 50-49
Using an Even turnout Romney wins 50-48.5
Using an R+5.8 turnout Romney wins 52-47

Final Gallup Poll - November 5, 2012

Likely Voter, 2551 sample size, Romney leads 49-48, 3% undecided.

I posted a small update earlier regarding Gallup, but they released their own analysis of the final poll that deserves comment.  If you look at RCP, they post a top line of 50-49 with Romney leading, but they do this by splitting the final 3% undecideds and giving half to each candidate.

As I mentioned before, it is hard to determine the partisan ID with Gallup, since they don't publish it.  However, I believe the sample has a D/R/I of 35/34/31.  Now this is a bit of a guess based on a couple factors.  First, there was a previous release where Gallup provided their sample which was about D+0.2.  Since then I have reasons to think they have moved to a slightly higher Democrat sample.  The following table gives a clue:


In this table we see that Romney is attracting 2% more crossover vote than Obama does.  We also see a slight 1% preference by Independents for Obama.  I'm estimating that we need a D+1 sample to result in a Romney +1 result.  If the sample were even, then Romney would be up by 2.

Putting these results through the models, we get the following:

R+1- Current result
O+2.4 - 2008 turnout
R+0.6 - D+3 turnout
R+2.8 - 2010 turnout
R+2.8 - 2004 turnout
R+5.9 - Rasmussen Party ID

As I look through the report, there are a few problems that I want to point out.  First is that slight Obama lead among Independents.  I think we can find the reason for both the significant loss of Romney's lead over the last few days and the loss of Independent support.  The following table shows support for each candidate among all voters by region:


Obama is leading by 20 points in the East, while losing by 4 in the Midwest, 10 in the South, and 6 in the West.  This race is being fought in the Midwest and South, not in the East.  That gaudy 20 point lead will be of no help to Obama, but it does serve to tighten this poll.

Additionally the Gallup poll suffers from the same over sampling of early voters as the other polls.
Thirty-two percent of likely voters interviewed Nov. 1-4 say they have already voted, while another 6% still intend to vote before Election Day.
38% of the 2008 electorate would be 49,000,000 votes.  The problem is that the actual early vote total nationwide currently stands at 30,000,000 or 23%.  This serves to again push too many respondents past the likely voter screen.


2,551/2,854 = 89.4%.  As I mentioned yesterday the participation rate in 2008 was 58.2%.  890 of these respondents say they will show up at the polls/voted, but won't/didn't.

Finally, I want to point out voter opinions on Obama's performance on key issues.


Unless the voters really want to elect a President of Hurricane Response, those disapproval numbers do not support a tie in the polls.  Being at -14 on the top issue of the campaign alone is enough to result in a a resounding defeat.

While I believe there are significant issues with this poll that are leading to an over statement of Obama's support, we will still look at what it is predicting.

The Gallup poll is predicting a final result of Romney winning 50-49.

However, using the models, it is predicting the following results:

Using a D+3 model Obama wins 50-49.5
Using an Even turnout Romney wins 51-48
Using an R+5.8 turnout Romney wins 53-47

Final Monmouth Poll - November 5, 2012

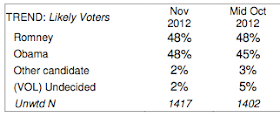
Likely Voter, 1417 sample size, Tied 48-48, 2% undecided.

Monmouth just released their final poll, and it matches every other poll, showing a tie.  The pollsters really don't want to make a call this election.  It is very similar to the last poll where they showed a 3 point Romney lead.  The D/R/I is D+4 at 35/31/34 which matches the last time this poll was conducted.  The Independent preference also matches the 16 point Romney lead we saw two weeks ago.


Notice however that Obama is getting more crossover support than Romney, which I find to be a little hard to believe.  The VERY odd thing in this poll though can be seen in the following table:


Of the undecideds that made up their minds, ALL of them went to Obama.  This strains credulity, and is the ONLY reason why this poll shows a tie.  Even a pessimistic, but believable 50/50 split would have resulted in a 49.5-46.5 lead for Romney.

Putting these results through the models, we get the following:

Tied - Current result
O+2.0 - 2008 turnout
R+0.9 - D+3 turnout
R+3.3 - 2010 turnout
R+3.4 - 2004 turnout
R+6.7 - Rasmussen Party ID

Like others, this poll does not make a prediction on who will win the race.  However, it indicates the following possible results:

Using a D+3 model Romney wins 50-49
Using an Even turnout Romney wins 51-48
Using an R+5.8 turnout Romney wins 54-47

Gallup

I'm seeing lots of discussion about Gallup down in the comments, so let me address it.

First of all, I am guessing with this poll.  They don't release internals, and I am basing everything off a partisan split that they published when they were taking heat for  showing Romney so far ahead.

The top line number is Romney leading 49-48 with 2% still undecided.  They give no indication of Independent preference.  However, being at 48 is not a good place for Obama to be.  My suspicion is that Gallup has been hit by the same "early voter" problem that all the other polls have.  We never got to see this play out, because we didn't see the daily tracking poll trend down over the last week.  Gallup uses a very tight likely voter screen, but if someone says "I voted" they go right in, regardless of whether it is true or not.

But, let's take the numbers at face value.  Putting this poll into my models using the same D+0.2 partisan split that they were using before, we get the following results.

If turnout is D+3, Obama leads by 0.5%
If turnout matches 2010, Romney leads by 1.8%
If turnout matches the Rasmussen Party ID poll, Romney leads by 5.0%

This poll only trails Pew right now as the best case scenario for Obama, and he still loses the election by almost 2 points if our turnout matches 2010.  And keep in mind, I am using every pessimistic assumption in this calculation, such as Independents have no preference between the candidates.

So quit worrying, and go vote.

STOP THE PRESSES!

I'm stunned.  I really am not sure what to make of these numbers.  If you thought Rasmussen's September poll of partisan ID was beyond belief, well the October numbers are incredible.  To refresh your memory, this poll is conducted monthly and asks 15,000 people what party they are affiliated with.  In my Rasmussen Party ID model, I use a 3 month average of these numbers.

The new October number is way beyond anything I was expecting.  The new numbers are:

Democrat 33.3%
Republican 39.1%
Independent 27.5%

The already amazingly good September number of R+2.6 went to R+5.8!

With the new October number, the 3 month average changes:

Old  -  New
33.8    33.6   Democrat
36.4    37.8   Republican
29.8    28.6   Independent

I will be now using an R+4.2 sample for my Rasmussen Party ID model.  Expect to see that number move much higher.  My analysis below changes to Romney leading by 6.9% in that model.

November 5, 2012 - The Penultimate Analysis

One more day.

Polls included:

Tracking Polls
Even - Rasmussen Daily Track
R+5 - Gallup
O+1.3 - IBD/Tipp
O+1 - ABC/WaPo

Others
R+1 - Battleground
O+3 - Pew
R+1 - NPR
O+1 - CBS/NYT
Even - Fox
O+5 - National Journal
Even - CNN/ORG
Even - NBC/WSJ

O+0.36% - Current RCP Average
O+0.64% - Average using the 2008 turnout model
R+2.27% - Average using the D+3 turnout model
R+4.57% - Average using the 2010 turnout model
R+4.64% - Average using the 2004 turnout model
R+6.39% - Average using the Rasmussen Party ID turnout model

Average Democrat advantage across all polls: D+5.22

The RCP shows a small drift toward Obama on the next to last day, driven my the inclusion of 4 new polls from CNN, Pew, NBC/WSJ, and Battleground, with the average Democrat advantage being driven largely by the D+11 CNN/ORG poll.  I have posted detailed analysis of each of those polls below.  These should all be final polls, and I will not be looking at them again.  Today we should see final polls from most of the other polling firms, and I will provide analysis of those as I am able.

In the tracking polls we continue to have no updates from IBD/Tipp and Gallup.  Drudge teased a Galup results showing Romney up 3 yesterday, but it was removed.  We are expecting them to provide final results today from their final days of polling.  IBD/Tipp I expect to not return, since they were severely affected by Sandy.

Rasmussen continues to show a tie, despite moving to a slightly more Republican baseline (D+2) and Independent preference moving back to a 9 point preference for Romney.  I believe that in the end, Rasmussen will probably be within a point or two, and will not sacrifice his reputation, however he is having some problems with his methodology.  A 9 point lead with Independents in a D+2 poll should be showing a 1 or 2 point Romney lead.  My suspicion is he continues to be plagued by too many Democrats making it past his likely voter screen.  This has been a systemic problem this cycle, which has cropped up especially in the last week while in the middle of the early voting season.  All of the pollsters will need to find a way to correct this problem next cycle if they wish to be accurate.

ABC/WaPo moved out to an Obama +1 lead while maintaining a D+4 sample.  Independent support for Romney increased to 2 points from the Even support they were reporting yesterday.  All in all, ABC/WaPo is looking to be fairly close in its results, once you account for the Democrat over sample.  They are indicating a Romney win of 2.5% if the turnout is Even.  I view this as a relatively conservative result, driven by the low preference for Romney by Independents.  Their over sample also appears to be caused by too many likely voters.  The results of this poll look a lot like a registered voter result.

Since several of the polls are getting very old, and in the case of Tipp may not even be updated, I'm offering an alternative set of results.  In this case I am throwing out the Gallup, Tipp, National Journal, NPR, and CBS/NYT polls because of their age.  I am also throwing out the CNN/ORG poll because it is an obvious outlier that is too good for Romney.  This leaves us with the 6 recent polls, 2 of which are tracking polls.

Polls included:

Tracking Polls
Even - Rasmussen Daily Track
O+1 - ABC/WaPo

Others
R+1 - Battleground
O+3 - Pew
Even - Fox
Even - NBC/WSJ

O+0.50% - Current RCP Average
O+1.60% - Average using the 2008 turnout model
R+1.30% - Average using the D+3 turnout model
R+3.60% - Average using the 2010 turnout model
R+3.66% - Average using the 2004 turnout model
R+4.17% - Average using the Rasmussen Party ID turnout model

This result is looking much more believable.  With an Even turnout, Romney will win by 3 to 4 points.  When Gallup releases their tracking poll I expect them to confirm this with a Romney lead of 3, as was teased yesterday.

Sunday, November 4, 2012

Final CNN/Opinion Research Poll - November 4, 2012


Likely Voter, 693 sample size, Tied 49-49, 0% undecided.

Everyone has been waiting all night for me to look at this one.  I figured I should go through the credible polls before this one.

So the race is tied.  Right.

Incredibly, this poll is even more over sampled than the one they did on 10/1.  I'm amazed they published it at all, it is so ridiculous.   The D/R/I of the poll... Oh why don't I just quote directly from the methodology?
Among those likely voters, 41% described themselves as Democrats, 29% described themselves as Independents, and 30% described themselves as Republicans.
You read that right.  D+11.

D+11!!

And RCP just puts it right into the average with all the others.

So how can a D+11 poll show an even race?  Why isn't it showing Obama ahead by 8 or 9, at least?

I'm glad you asked.  Independents favor Romney in this poll by 24 points.  Oh, don't take my word for it, it is right there in the crosstabs:


So for laughs, let's put these numbers into the models:


Even - Current result
R+2.8 - 2008 turnout
R+5.7 - D+3 turnout
R+7.9 - 2010 turnout
R+8.0 - 2004 turnout
R+9.6 - Rasmussen Party ID

When I include this poll into the averages, it will push the numbers up about .25% even with 12 polls.  I will also being doing a version of the averages where I throw out the obvious outliers.  This poll will have to be thrown away, it favors Romney beyond reasonable expectations.

Anyway, this poll is saying that it is too close to call, and the final result will be:

Tied race 49-49

The models instead indicate that this poll is projecting the following:

Using a D+3 model Romney wins 53-47
Using an Even turnout Romney wins 54-46
Using an R+2.6 turnout Romney wins 55-45

Final NBC/WSJ Poll - November 4, 2012


Likely Voter, 1475 sample size, Obama leads 47.5025-47.4975, 3% undecided.

If you haven't noticed my irritation with RCP and poll reporting, the lead numbers above should give you a clue.  The top line numbers are reported as "Obama +1" then you read into the article and find out that
Mr. Obama led his rival by a whisker, 48% to 47%—a difference of seven voters among a pool of 1,475 surveyed.
1% out of a pool of 1475 is 147 voters.  7 out of a pool of 1475 is 0.005%.  Honest reporting of this poll would declare it tied.

As I did with the Battleground poll, I am changing their method of sample determination.  They use a metric of "leaning" Independents, which obviates the concept of partisan turnout.  The last time I looked at this poll the D/R/I was 44/38/18 or D+6.  The following is their sample data:


The proper identification of the partisan ID for this poll is 31/26/41 or D+5.  Additionally they report that Independents favor Romney by 7, however the "leaning" independents favor Romney by 3.  This leads to an overall Independent support of slightly over 2 points (remember that was 7% of a 14% subsample).

When we adjust this result to the different models, we get the following results:

O+0.005 - Current result
O+1.5 - 2008 turnout
R+1.9 - D+3 turnout
R+4.5 - 2010 turnout
R+4.6 - 2004 turnout
R+6.6 - Rasmussen Party ID

This represents about a 1 point shift toward Obama since the last time the poll was run, but Romney retains a comfortable lead in all possible turnout scenarios.

Going through the crosstabs, one omission stands out when looking at specific issues of importance to the electorate:


The voters are not asked who would be better dealing with the economy or jobs.  These two issues are 3 times more important to the voters than all other issues, when asked in other polls.  The fact that the pollster doesn't even ask is telling.

In summary, this poll does not attempt to predict who will win the race.  Leaving the result at 47.5-47.5.  However, using the models, it is predicting the following results:

If turnout is D+3 Romney wins 50.5-48.5
If turnout is Even Romney wins 52.5-48
If turnout is R+2.6 Romney wins 54-47.5

Final Pew Poll - November 4, 2012


Likely Voter, 2709 sample size, Obama leads 48-45, 4% undecided.

Again, RCP chooses to select among two numbers provided by the poll and chooses the one more favorable to Obama.  RCP is reporting Obama leading 50-47, but that number is only acheived by allocating the undecided voters 50/50.  This is not a very good approach, since undecideds at this point are likely to either support Romney or not vote.  It is another example of RCP cherry picking to show a result more favorable to Obama.

The last time this poll was run the D/R/I was 35/34/30 or D+1.  This time they have increased the Democrats in the sample to D+4 with a D/R/I of 36/32/29.  Independents have moved from favoring Romney by 8 to favoring him by 2.

Putting these results through the models, we get the following:

O+3 - Current result
O+4.0 - 2008 turnout
O+1.1 - D+3 turnout
R+1.2 - 2010 turnout
R+1.3 - 2004 turnout
R+3.1 - Rasmussen Party ID

Even with the partisan split, this poll is still showing a shift toward Obama of about 1.5 points.  Having said that, consider the following table included in their release:


Notice that the enthusiasm number for Republicans has increased since the last poll and they maintain a significant advantage over the Democrats.  This leads to the conclusion that a D+4 turnout is very unlikely to occur, and that the Even or better turnout I expect is more likely.

So why is this poll so skewed?  The obvious answer can be found in the following table:


The like voter screen is way to loose, and is certainly driven by the fact that 34% stated they have already voted.  The total of early votes nationwide is barely over 20%.  Whatever the reason, the likely voter screen indicates that we will have an 85.9% participation rate.  Here are the participation rates of all Presidential elections going back to 1988:


Clearly, Pew has too many Likely Voters in their screen.  About 27.7% too many.  History has shown that Likely Voters trend toward Republicans more than Registered Voters.

In the end, this is Pew's final opinion on this race.

Pew's final prediction is Obama winning 50-47.

However, based on the evidence within their poll, I believe this poll properly points to a Romney victory.

Pew's poll supports a prediction of Romney winning between 50.2-49 and 51-48.

Final? Battleground Poll - November 4, 2012


Likely Voter, 1000 sample size, Romney leads 49-48, 3% undecided.

Let's start with the top line number.  The last time this poll was run, one week ago before Sandy, Obama was ahead 49-48.  So this poll has moved 2 in Romney's direction, so much for that Sandy bump.  Now if you look on RCP and the Politico article, you see this listed as tied.  However, look at the following from inside the poll:


By my math that adds up to a 49-48 Romney lead.

Next I want to look at the partisan sample.  This has been a particular problem with this poll, since they push people to identify as partisan due to their "leaning".  They then provide a preference of the very few remaining Independents.  Here is the results of this poll:


In the past I have used the numbers as is, and used the models to reweight.  However, since they have forced Independents into this artificial construct this time, I am putting them back where they belong and using the "lean" to determine Independent preference.  The D/R/I for this poll is really 36/31/30, with Independents favoring Romney by 2 points.  It is a D+5 poll.


Putting these results through the models, we get the following:

R+1 - Current result
R+0.3 - 2008 turnout
R+3.3 - D+3 turnout
R+5.6 - 2010 turnout
R+5.7 - 2004 turnout
R+7.4 - Rasmussen Party ID

This poll indicates a very strong Romney lead by at least 3 points when the votes are counted.  It isn't just me saying that, it is the Terrance Group's opinion as well.  With their final poll, both Terrance Group and Lake offer a final prediction.  Here is the Terrance one:
In sum, this data indicates this election continues to remain very close on the surface, but the political environment and the composition of the likely electorate strongly favor Governor Romney. These factors come into play with our “vote election model” – which takes into account variables like vote intensity, voters who say they are definite in their vote, and demographics like age and education. In that snapshot of today’s vote model, Mitt Romney has majority support (51%). This is an election that will be decided by voters’ focus on the economy, and by turnout and intensity – as we enter the last 72 hours of the campaign, both of those factors favor Mitt Romney.
 Now before you think I am just cherry picking the Republican version, let's also look at the Lake analysis:
In the final days of the campaign, a majority of voters expects and awaits the President’s second term—a metric that has historically had a better record of predicting Presidential electoral outcomes. Cementing voters’ expectations of an Obama victory requires that the President and his Party drive Democratic turnout and maintain their edge among independents. Obama and Democrats have already managed to lock in more support than their Republican counterparts among those who have already voted and have critical advantages on which to build to help propel turnout. Sustaining Democrats’ early vote leads will necessitate they maintain, if not redouble, the strength of their ground game in these final days, particularly in battleground states that remain divided in their support for Obama and Romney. 

"a majority of voters expects and awaits the President’s second term—a metric that has historically had a better record of predicting Presidential electoral outcomes." - What does this even mean?  That because people expect Obama to win, he likely will win?  Why do we bother with elections then?

"President and his Party drive Democratic turnout and maintain their edge among independents." - Didn't the poll already show that Independents favor Romney?  And what about the increased enthusiasm that is visible to us all and mentioned by Terrance Group?

"Democrats have already managed to lock in more support than their Republican counterparts among those who have already voted" - Other polls show this to not be true, and actual votes submitted so far shows the Democrats far behind their goals.

"necessitate they maintain, if not redouble, the strength of their ground game in these final days" - This seems to indicate that the current efforts are insufficient to achieve victory.

To sum up, the Republican pollster from this partnership is offering a specific prediction of Romney's final vote results.  The Democrat is offering platitudes and advice, without making a prediction of Obama winning.

The Battleground final poll predicts Romney will win 51-48.

A couple videos to get you pumped up


When the story of this campaign is written there will be two points where the tide turned and Romney became the 45th president.

The first was in Denver, in the first debate.  That was when we learned that we could trust him, we could believe in him, that he had what it takes to be President.

The second was Red Rocks.  That was where he learned he could believe in us.  That we would be the movement he needs to win.

RDBrewer at Ace reworked the official Red Rocks video with a more uplifting soundtrack

Here is the original

Finally, a new one the campaign released today from the Friday rally in Ohio

Two more days until it is our turn.

Battleground Poll - November 4, 2012


Likely Voter, 1000 sample size, Tied 48-48, 3% undecided.

This is a place holder for a later update once I can find the internals.  I am currently only able to work off the article at Politico, which has picked numbers out of the poll to report, without linking to the full data.

Despite the discussion in the article that "Obama has gotten a boost from Hurricane Sandy", please remember that this poll was Obama +1 last time it was run.  Obama has lost a point of support in the last week. 

They also report that Independents now favor Obama by 1 point, but note that the change is because voters that previously identified as Independent are now reporting as lean Republican.  I've avoided playing with their sample numbers in the past to correct their "lean toward a party" sub-sample, but it looks like I will have to finally, just to get a consistent sample for my models.

Once I can get the internals, I will post the model results.

November 4, 2012 Analysis


Polls included:

Tracking Polls
R+0.8 - Rasmussen Daily Track
R+5 - Gallup
O+1.3 - IBD/Tipp
Even - ABC/WaPo

Others
O+1 - Battleground
Even - Pew
R+1 - NPR
O+1 - CBS/NYT
Even - Fox
O+5 - National Journal

O+0.15% - Current RCP Average
O+0.73% - Average using the 2008 turnout model
R+2.05% - Average using the D+3 turnout model
R+4.28% - Average using the 2010 turnout model
R+4.33% - Average using the 2004 turnout model
R+6.06% - Average using the Rasmussen Party ID turnout model

Average Democrat advantage across all polls: D+4.16

The national polls continue to show a tie.  They also continue to assume a Democrat turnout advantage of over 4 points.  I think we can safely say that if the Democrats are able to turnout 5,200,000 more voters than Republicans, then the race will indeed be close.  As I said yesterday, I view such a turnout advantage to be very unlikely.  I believe that as we moved closer to the election, too many Obama voters were making it through the likely voter screens by falsely claiming to have already voted.  This was especially prevalent in state polls, but it also is affecting national polls.

The only polls that released new numbers were Rasmussen and ABC/WaPo.  Rasmussen showed no change, while Independent support for Romney returned to +4.  ABC/WaPo dropped into a tie.  This was because their sample expanded back to D+4.  Oddly, they also found that Independents have no preference, with equal support for Obama and Romney, an 8 point swing in one day.  I believe this result to be unlikely, but I included their result in the averages.

Overall, my conclusions from yesterday remain the same.  If turnout is D+3 or better for the GOP, then Romney will win the election.

Tomorrow everyone will be releasing final polls.  I intend to post analysis of their results, and make a final prediction.

Saturday, November 3, 2012

Senate Update - Gut Feelings

I really don't have much new information, but my feelings about the overall state of turnout results in some movement in these percentages.

Here is my opinion on all 16 of the current Senate races I am following.
  • Nebraska 100% -  With GOP enthusiasm where I think it is, Kerrey has no chance of winning this race.  He was close in one poll, but that poll assumed Democrat enthusiasm that isn't there.
  • Indiana 50% - I still think Mourdock will win this, but there was a new poll that showed Donnely up 11.  I don't buy that poll, but it is enough to make me cautious.  So no change in this one.
  • Nevada 100% - Heller remains well ahead, even with Obama leading in the polls there.  This race is still over.
  • Wisconsin 90% - Romney is looking very strong in this state, and is confident of winning it.  That means Thompson will win too.  I'm raising these odds to 90%.
  • Montana 60% - No change here.
  • Massachusetts 60% - A new poll came out with Brown up 2.  I'm getting a lot more confident on this race, moving it up to 60% for now.
  • Virginia 80% - Romney is winning this state, no question about it.  Allen will win too.  I'm moving this up to 80%.
  • Florida 20% - I'm dropping this one to 20%.  Romney is running very strong, but Mack has run about the worst campaign I've ever seen.  He has no ads up.  The only way he wins is with a huge GOP turnout.
  • Ohio 75% - After looking deeply into Ohio yesterday, I think Mandel will win this race.  The polls are just not telling the true story, and Brown needs the early votes just like Obama does.  Those votes aren't there.
  • New Mexico 10% - No change, I think Wilson will lose.
  • North Dakota 90% - Moving this back up to 90%.  With GOP turnout, Berg will win this.
  • Missouri 60% - Similar to what is going on elsewhere, I think Akin will win this.  Romney holds a commanding lead in the polls, McCaskill is really disliked in the state, and the evangelicals are going to turn out.
  • Michigan 10% -  No polling, but I see no reason to believe Hoekstra can win.
  • Maine 10% - The Independent will win this race.  He could decide to caucus with the GOP, especially if it means being in the majority.
  • Pennsylvania 60% - New polling shows Romney and Smith ahead.  I think both will win this state given last weekend enthusiasm.  Romney going to Bucks County is a big deal.
  • Connecticut 20% - Dropping the odds to 20% here.  I'm seeing no evidence that McMahon is going to close the deal.  And she could end up with Dems and Independents voting against her to keep the Senate out of GOP hands.

Odds of at least a tie in Senate = 95.9%
Odds of winning the Senate = 89.1%

November 3, 2012 Analysis - Final Weekend


Polls included:

Tracking Polls
R+0.8 - Rasmussen Daily Track
R+5 - Gallup
O+1.3 - IBD/Tipp
R+1 - ABC/WaPo

Others
O+1 - Battleground
Even - Pew
R+1 - NPR
O+1 - CBS/NYT
Even - Fox
O+5 - National Journal

O+0.05% - Current RCP Average
O+0.76% - Average using the 2008 turnout model
R+2.02% - Average using the D+3 turnout model
R+4.26% - Average using the 2010 turnout model
R+4.30% - Average using the 2004 turnout model
R+6.04% - Average using the Rasmussen Party ID turnout model

Yesterday we had a 1.2% drop in Rasmussen that lead to a collective freak out by all the nervous poll junkies, because it was reported as a tie.  Later in the day, ABC/WaPo posted a gain for Romney.  The most important part of the ABC/WaPo poll was Independent preference moving back to +8 and half of the 2% undecideds making up their mind and committing to Romney.

The "second look at Obama" is now over, and we won't seeing any more movement toward him in the polls.  There are four reasons for this:

  1. The bump he was getting from Sandy is now over, and it is becoming a liability as he must campaign while everyone is seeing people homeless and in gas lines.  A lot of people are now asking why FEMA can't get gasoline into New Jersey and shelters into Staten Island.  The excuse that it isn't FEMA's job isn't going to work after Obama's bold statements during his photo ops.  Bloomberg did Obama no favors with the NYC Marathon stupidity.
  2. Benghazi is now back into the news as the CIA releases timelines that raise more questions than they answer.  Additionally, having two GOP Senators succeed in getting access to the prime suspect in 2 days, while the Government couldn't for 7 weeks makes Obama look ineffectual.
  3. Minds have now been made up.  The final weekend is about turning out your base and organization.  There are no opportunities left to change voter minds.
  4. The difference in energy levels and enthusiasm between the two campaigns is palpable.  Obama was barely able to draw 2,800 in Ohio in one of his strongholds yesterday.  Romney drew 40,000 outdoors in the cold in Ohio.  On Saturday, Ryan will be in Minnesota.  On Sunday Romney will have a huge crowd in Bucks County, PA.  The visual contrast between the campaigns is impossible to ignore.
In my opinion, there are three possible election scenarios that could play out on Tuesday.  In only one of them does Obama have a chance of winning.

D+3:  The least likely scenario is that Democrats turnout at 3% higher than Republicans.  This is the "split the difference" scenario that pundits have been using all year.  Take the Obama enthusiasm from 2008 and the GOP enthusiasm from 2010 and assume a turnout between them.  This is now very unlikely to occur.  We have specific evidence that the GOP 2012 enthusiasm is at or above 2010 levels.  Obama's early voting numbers are crashing and he can't fill a venue, signs that Democrat enthusiasm isn't there.  Finally Independents are supporting Romney by the same rate they supported the GOP in 2010.  However, even with this scenario, Romney leads by 2 points and would get a 50-48 win.  The only way that Obama could win is through massive voter fraud.  This would require the production of 2,600,000 fraudulent votes and would very likely be detected.  We would have a constitutional crisis.  In this model, Romney wins close races in Ohio, Colorado, and Florida, winning 275 electoral votes.

Even: I view this turnout model to be the most likely.  Obama has a small lead in early voting that is overwhelmed by GOP turnout on Tuesday.  Obama is still able to get his core supporters to the polls, but it isn't enough to compensate for a very fired up GOP base and the Independents.  One thing to keep in mind is that the Rasmussen and Gallup party preference polls are real.  They really do show, at this point in time, that the Republicans hold a 1 to 3 point advantage in party identification.  In this model, both parties get their bases to the polls, and the GOP misses just slightly their high water mark.  In this scenario, Romney leads by over 4 points, and would win 51-47.  He takes OH, CO, FL, IA, NH, WI, and PA, winning 315 electoral votes.

R+3: After watching the Romney rally in Ohio, I am seeing this result as much more possible.  If Romney's energy continues to build, and Obama continues to make gaffes like "revenge voting", then we see massive turnout on Tuesday.  The GOP gets all of the self identified Republicans, and the reports that Obama has been cannibalizing his election day voters turns out to be true.  In this scenario, Romney wins by over 6, with a 52-46 final tally or better.  This would be a similar result to the 1988 election.  Romney would win OH, CO, FL, IA, NH, WI, PA, NV, OR, and ME-2 for 329 electoral votes.  He would also have a good shot at winning MN and MI.

Romney is going to win.

Friday, November 2, 2012

DON'T PANIC

I knew I should have posted this first instead of working on my Ohio post.

Rasmussen isn't tied, despite what you are seeing on RCP.  The actual number is Romney 48.4 - Obama 47.6.  You are seeing a rounding error.

Please keep in mind that Rasmussen is using a D/R/I of 39/36/25 and is showing Independents favoring Romney by 3 points and a 5 point cross over advantage.

If turnout is Even like I expect, then Romney leads in this poll by 3.6.  If Rasmussen's own party ID poll is correct, then his lead is 5.3%.

Obama is at 47.6% in a D+3 poll 4 days before an election and his early voting numbers have crashed.

Explain to me how this points to an Obama victory?  Because if that happens, it will be the first time in history.  Kerry was at 47.4% at this point, lost the election, and won the Independents.  And he didn't have skewed polls inflating his advantage.

If the Democrats can turnout at D+3 in this environment, given the level of enthusiasm the Republicans have, then they deserve to win.  So quit panicking, go volunteer, and damn it VOTE!

Update: The ABC/WaPo tracker cancelled out Rasmussen by moving two points toward Romney.  This was mostly due to Independent preference moving from +3 to +8 in one day.  Probably a good Obama day (during Sandy) dropped off, while a good Romney day moved in.

The Big Ohio Update

I'm going to cover a lot of ground in this post, so hang in there.

Polling update

One new poll comes into the RCP, this time from University of Cincinnati showing Obama up by 2. Let me warn you up front, this is an outlier.  The Independent preference is not following any of the other polls, and I am very suspicious of it.  The D/R/I of the poll is 42.68/42.07/10.87 with Independents favoring Obama by 14 points.  Since they only polled 140 Independents, I am really suspicious of the results.  When I put this poll into the models, they look very very bad for Romney.

O+2 - Current result
R+1.25% - 2004 turnout model
O+7.18% - 2008 turnout model
O+1.68% - 2010 turnout model
O+2.15% - 2012 registration model
O+4.32% - D+3 turnout model

The Independent preference is simply wrong.  I really just can't put any faith in the poll at all.  Trying to figure out what could be causing these results, I noticed that 40% of the poll respondents are from Northeast Ohio.  According to the numbers I can find, this section of Ohio only represents 30% of the population, but it is the stronghold for Obama.

Despite how unbelievable this poll is, I will go ahead and include it in the model and look at the results:

Polls included:
O+3 - Survey USA
R+2 - Rasmussen
O+4 - PPP
O+5 -Quinnipiac
O+2 - Purple Strategies
O+4 - CNN/ORG
O+2 - ARG
O+1 - Gravis
O+2 - U of Cin.

O+2.33% - Current RCP Average
R+6.76% - Average using the 2004 turnout model
O+2.72% - Average using the 2008 turnout model
R+3.53% - Average using the 2010 turnout model
R+2.84% - Average using the 2012 registration model
R+0.63% - Average using the D+3 turnout model

This one poll drops Romney's average across all the models by about .7%.  Despite this outlier, Romney still leads in Ohio by better than 3 points if we have an Even turnout, and is tied with a D+3 turnout.  This is really the crux of the election.  Will the Democrats have a +3 turnout edge or not.

Credible Poll Averages

In 2004 I was hanging out on a blog that was working through all the polling.  Things were a lot like this weekend before the election.  New polls were cropping up all the time showing Kerry surging.  We had a polling professional on the site who would look into the polls and declare them credible or junk.  He would simply ignore junk polls and only pay attention to the credible ones.

I'm going to do something similar.  If I look at the internals and history of these polls, I can see which polls are getting credible data, and which ones are outliers.  Even polls that are D+8 can still be credible, if the internals of the poll are consistent with the trends we are seeing.  In these cases they are simply sampling too many Democrats.

Using this screen, I'm keeping the following polls and running the models:

O+3 - Survey USA
R+2 - Rasmussen
O+4 - PPP
O+5 -Quinnipiac
O+2 - Purple Strategies
O+1 - Gravis


In the end, I am throwing out the CNN and U of Cincinnati polls because their Independent preference results don't match the rest.  I am also throwing out ARG because their Ind +21 result for Romney is also not credible.  The remaining polls range from Romney +2 to +11.

O+2.17% - Current RCP Average
R+7.78% - Average using the 2004 turnout model
O+1.89% - Average using the 2008 turnout model
R+4.50% - Average using the 2010 turnout model
R+3.78% - Average using the 2012 registration model
R+1.55% - Average using the D+3 turnout model

These results do a better job of reflecting the current state of the race.  If we have a D+3 turnout, then Romney will win Ohio by a close number.  If we have an Even turnout, Ohio will be called early with Romney winning by about 250,000 votes.

Early voting

Below are the reported numbers of early votes cast in Ohio as of November 1st.  This does not represent all of the counties, apparently those are not online.  Overall the counties listed in this picture represent 79% of all of the votes cast in 2008.


I spent a few hours with these number this morning, and can draw a few conclusions.  The major Obama strategy is to use early voting to run up the vote totals.  I have found a quote by a Professor at University of Dayton that McCain actually won the vote on election day.  Where Obama developed his 4.6% lead was in early voting.  I tried to find evidence this morning that confirmed this statement, but couldn't (just a lot of people quoting him).

Assuming he is right, then the 260,000 votes that Obama won by in 2008 came exclusively from early votes.  Now in 2012 the number of voters statewide has dropped 5.9%.  Unfortunately for Obama, Cuyahoga county dropped 19%, by far the largest loss of any county in the state.  But assuming a statewide distribution, Obama would need to bank about 245,000 extra votes in early voting to replicate his 2008 win.

So if we look at actual votes received by county and compare them to the early vote percentage in that county, we find that 1,063,851 votes have been received so far.  But to match the 2008 numbers we would expect 1,423,425 early votes to be cast.  Early voting is currently down 359,574 votes in these counties.  Remember, these counties only represent 79% of the 2008 electorate.

Using the vote share that Obama enjoyed in each of these counties, we can estimate how many early votes Obama received in each county.  This estimate favors Obama slightly, since his actually numbers were higher due to his focusing on this strategy.  This reveals Obama's under performance in early voting, how many votes he should be getting in each county, and how many votes he still needs to meet his turnout goals.

Adding it all up, as of November 1st, Obama is 208,598 votes under his targets in these counties.  extrapolating to account for all counties, he is 261,955 votes under his goals.  We can drop that number a little to account for population loss and say he is 246,499 votes short of his target.

In other words, his early vote performance advantage is wiped out, and he is tied.  This is before considering any other factors.

Let's take a closer look at his strongholds.  These are the large urban areas that he won convincingly in 2008.

  • Cuyahoga County voted for him 70% and had 265,000 early votes - currently 69,000 votes short
  • Franklin County voted for him 61% and had 250,000 early votes - 73,000 votes short
  • Lucas County voted for him 67% and had 63,000 early votes - 20,000 votes short
  • Mahoning County voted for him 66% and had 40,000 early votes - 9,000 votes short
  • Summit County voted for him 59% and had 60,000 early votes - 27,000 votes short

Compare this to one of the McCain counties

  • Warren County voted for him 32% and had 24,000 early votes - 2,000 votes short
A lot of McCain counties aren't even reported, like Butler County that had a total of 173,000 votes and voted for McCain by 60%.

Independent votes

In 2008, Independents made up 30% of the electorate in Ohio and favored Obama by 8 points.  This is a vote total of:

  • Obama - 923,000
  • McCain - 787,000
  • Advantage Obama -  136,000 votes
This year, that trend is reversed.  Romney is holding an average advantage of 8 points with Independents.  Assuming a 5.9% reduction in overall votes but the same 30% share of the electorate, this becomes:

  • Obama - 740,000
  • Romney - 869,000
  • Advantage Romney - 129,000 votes


Summing it all up

The early voting results suggest that Obama and Romney will enter Election Day tied in Ohio.  In 2008 McCain under performed what the GOP was able to produce in 2010 by 6 points.  This represents a total of about 321,000 votes (6% of 2008 - 5.9% loss in population) that Romney should be able to produce through enthusiasm.

Let's assume that the Democrats are also able to increase their election day totals accounting for new voters (scoff) and fraud.  I will go ahead and spot them 10% of their early vote totals in their strongholds to account for double voting on election day.  This would give them an additional 50,000 votes.  Also giving them a 3% increase in election day turnout (3% of 2008 - 5.9% loss in population) I will give them another 160,000 votes.

Romney turnout increase = 321,000 votes
Independent advantage = 129,000 votes
Obama early vote advantage = 0 votes
Obama turnout increase = 160,000 votes
Obama fraud = 50,000 votes

Romney will win Ohio by 240,000 votes.

November 2, 2012 Analysis


Polls included:

Tracking Polls
R+2 - Rasmussen Daily Track
R+5 - Gallup
O+1.3 - IBD/Tipp
O+0.07 - ABC/WaPo

Others
O+1 - Battleground
Even - Pew
R+1 - NPR
O+1 - CBS/NYT
Even - Fox
O+5 - National Journal

O+0.04% - Current RCP Average
O+0.61% - Average using the 2008 turnout model
R+2.18% - Average using the D+3 turnout model
R+4.42% - Average using the 2010 turnout model
R+4.47% - Average using the 2004 turnout model
R+6.20% - Average using the Rasmussen Party ID turnout model

Two things happened yesterday in the RCP average.  First the Rasmussen didn't change even though all of the weekend polling dropped off.  The last two days of polling matched the Sat/Sun numbers, which generally means a shift toward Obama.  However, keep in mind that Romney is still leading by 2 in a D+3 poll.  This is a good lead.  It is also possible that the hurricane is disrupting their polling operations since they are located in New Jersey.   Additionally, Rasmussen has switched to 1000 samples every day, from their typical 500 samples.  I don't know how it could be affecting the results, but I wanted to put it out there.

The ABC/WaPo tracker also shifted very very slightly toward Obama.  I am listing the actual lead above, instead of the +1 that RCP is listing.  The sample moved to D+4 from D+5, so it is a legitimate shift in the poll.  This is mostly due to Independents moving from favoring Romney by 6 to 3.  One more point about this poll is that 20% of the respondents say they have already voted, while 19% say they plan to.  I find it difficult to believe that 25 million people will vote over the weekend, especially since many large states, like Pennsylvania, do not have in person voting.

So after discussing all the movement toward Obama, let's keep in mind the real state of the race.  Even with the terrible National Journal poll in the averages, Romney is still leading by over 2 points with a D+3 turnout.  And with the 2010 turnout that I personally expect, Romney will win by over 4 points. If we drop that National Journal poll out of the averages, Romney leads in these two models by 2.4% and 4.6% respectively.

This is a bit like in 2008 when McCain had a minor surge in the last week, but it wasn't enough to overcome Obama's lead.

Thursday, November 1, 2012

Another look at the Economy

I went through all of the current polls in the RCP to find out what the voters think about the economy, and who will do a better job handling it.  I did NOT adjust the results to fit any turnout models.  These are the straight top line results from these polls, with the Democrat skew still included.

How important is the Economy to the voters this year?  Three of the polls give results of how much the respondents care about it.
  • Fox found that 44% rated it as a top issue, the next most important issue was 18%
  • Pew found that the ecomony and jobs combined as the top issue for 50%, with the next most important at 9%
  • Battleground found that 32% rated it as the top issue, while the next most important was 14%
Within the polls themselves, Romney wins on this issue in every poll.  Even without reweighting.
  • Fox - Romney leads 52-43
  • ABC/WaPo - Romney leads 49-47
  • CBS/NYT - Romney leads 51-45
  • Pew - Romney leads 50-42
  • NPR - Romney leads 50-46
  • Battleground - Romney leads 51-46
On average, Romney leads by 5.66% on this issue in every poll.  And these polls average a D+4.

So while we get caught up in stressing about the horse race, please remember that there are fundamental reasons why a sitting President is in so much trouble.  The challenger is viewed as better able to deal with the number 1 issue of the election.  An issue that is 2 to 3 times more important to the electorate than any other issue.


A Very Good Look at Polling and Poll Analysis

Dan McLaughlin (also known as Baseball Crank) has an excellent article at RedState discussing polls, and why we need to take them with a grain of salt this year.  It is a very long article, but well worth the read if you want to understand the underlying math and assumptions that goes into using small samples to predict the behavior of large groups.

Yesterday, in one of the comments, I mentioned that I am less concerns about "movement" in the polls right now, than I am with the facts on the ground.  We can get caught up in a small polling bump for Obama and start worrying about its meaning.  But small bumps in polling averages have very little import 5 days from an election.  As Dan says in his article:


Obama is getting clobbered with independent voters, traditionally the largest variable in any election and especially in a presidential election, where both sides will usually have sophisticated, well-funded turnout operations in the field. He’s on track to lose independents by double digits nationally, and the last three candidates to do that were Dukakis, Mondale and Carter in 1980. And he’s not balancing that with any particular crossover advantage (i.e., drawing more crossover Republican voters than Romney is drawing crossover Democratic voters).

We are now in the period where the campaigns are executing their ground game.  What is important to the campaigns is executing their early voting operations and getting their voters to the polls on election day.  Swaying the last few undecided voters toward your message is of much less importance to winning.

For the most part, the War for Independents is over.  Obama started the war by trying to damage the Romney brand using 5 months of negative campaigning.  The negative War on Women and Bain ads are still running in Florida.  Romney instead tried to woo them by convincing them "we can't afford another 4 years".  He got their attention during the first debate, and has solidified their support during the last two weeks by promising to "reach across the aisle".  This is the same message that Obama used in 2008 to great effect.  It is also a message that Obama can not use this year.  His governing style over the last 4 years would make that claim laughable.  As we enter the last 5 days, Independents are favoring Romney by an average of 8 points in all the current national polls.  This is about a 20 point swing from 2008, when Obama dominated.

Now we are in the period of the early voting ground game.  This is where Obama won the election in 2008.  He ran up such an advantage among early voters that year, that in many states, such as Florida and North Carolina, even though he lost the vote on Election Day, he still won the state.  But Obama's early voting advantage has collapsed.  Over on Breitbart they discuss Pew's finding that Obama is suffering from a 26% drop in early votes.  Over at AEI, Henry Olsen takes a look at the Ohio early votes and find support for Romney's claim that they are turning out new GOP voters, while Obama is underperforming in counties that support him.  A key paragraph from his analysis:

The numbers are particularly strong for Romney in the southeastern coal country on or near the Ohio River. From Scioto county in the south to Columbiana county in the north, early voting shares range from a low of 63.5% in Monroe to 82.7% in Columbiana. (Athens County, an Obama stronghold because of Ohio University, touches the Ohio River- its early voting share is only 57.4%). To compare, the early voting shares in the largest and strongest Obama counties (Cuyahoga, Lucas, Franklin, Summit, and Lorain) never top 61.0% (Cuyahoga).
If these early voting trends continue, then Romney will have erased Obama's strongest advantage in the race.  It will all come down to turnout on election day.  This is an area that Reince Priebus at the RNC has focused on specifically for the last two years.  They tested the methods in June in Wisconsin during the Scott Walker recall, and were able to over perform all expectations during election day.  Walker was able to win 60 of 72 counties, and cruised to an easy victory, well beyond expectations.

So take a deep breath and focus on the important things now.  Watch where the the campaigns are going (Wisconsin), and take heart that the Romney campaign is where they wanted to be, and are executing their final week strategies.

One final note from Dan's article.  I want to note his unknowing acknowledgement that my efforts here are on the right track.

One of the more widely-discussed efforts to fix the problem of topline poll data varying by turnout models is Dean Chambers’ UnskewedPolls.com, which takes the internals of each poll and re-weights them for a more Romney-friendly turnout model. In concept, what Chambers is doing is on the right track, because it lets us separate how much of the poll toplines is due to the sentiments of different groups and how much is due to assumptions about turnout.


Hat tip to Matt for pointing out this article to me.